urbanter

Student blog of the Stanford University Urban Studies Department

Monthly Archives: November 2011

The Psychology of Urban Culture

I recently read an intriguing post on This Big City called How London Tried (and Failed) to Become a Cycling City. The author makes the argument that part of the reason for this failure may be the attitude towards bicycling fostered during World War II, thus providing a psychological explanation for the disappointment of the city’s cycling initiatives. In the Netherlands, the occupying Germans stole thousands of bicycles from the residents, depriving them of their primary mode for short, efficient travel. In London, on the other hand, World War II brought unprecedented bicycle use out of necessity because of strict gasoline rationing. By the end of the war, the Dutch could not wait to get back on their bikes while the British quickly readopted the automobile. 

The post also supplements the explanation of London’s failure (specifically to meet its 12% bicycle modal share by 2012) with spatial and infrastructure-based reasoning, revealing the challenges in having an extremely concentrated financial district and a lack of small mixed-use developments. But overall, I was completely fascinated by this connection between historical events and culture. Can the perspective-changing, culture-defining role that World War II has played in the urban imaginary of European cities be justifiably used as an explanation for behavior patterns–and their stubborn stagnance?

Bike

(Source)

Newton’s law is convenient here: we’re all taught that for every action, there is an equal and opposite reaction. Amsterdam was stripped of its bicycles, and thus jumped right back on them as soon as they could, reinforcing their thriving bicycle culture. London was bound by scarcity, and thus adopted the car in a frenzied postwar attempt to demonstrate progress. If these cities were defined by their deprivation, is America a nation defined by being deprived…of everything? Is our insatiable thirst for consumption a remnant of our immigrant past and contining immigrant reality, driven forward by the desire to acquire houses, clothes, food, gadgets, vehicles–in essence, lifestyles–that weren’t available in our countries of origin? 

The tendency of people to react with consumptive tendencies in the face of scarcity is natural, and given a traumatic era like that which spanned both World Wars, explosive growth in automobiles before another war came around does not seem out of place. What is unnatural, though, is our clear ability to consume (pioneered by Americans, but proving increasingly contagious) even when we know that it is in our best interests to restrain ourselves. It is interesting to factor in this psychological component of historical deprivation because it provides an explanation that goes beyond individual greed to create a collective experience of absense or shortage.  

This isn’t to say that artificial actions will produce the reactions we desire. Urban waste won’t be solved by confiscating peoples’ compost bins, nor will shutting down homeless shelters produce an inevitable upsurge of community activism. Solutions to urban problems surely involve education, regulation, an proactive policies. But above all, they require understanding, and examining the historical underpinings of local resistance to behavioral change is a useful and informative exercise. 

socioeconomicas de parques

Recently another birthday came and passed and I started reminiscing about my childhood a little bit. In particular I started thinking about the playground where I spent most of my early summers. I am just realizing now that when we jumped off the swings mid-air or flew off the end of the slide we would land in wood chips, mulch, or little pebbles. There was in fact very little grass in this playground that was an island in the middle of a concrete neighborhood. It feels worlds away from Parque Bustamente that is around the corner from where I stay with my host family in Providencia, Santiago. I walk through the park almost every day to get to the subway station and it amazes me every time how widely used the park is- there is basic workout equipment bolted to the ground, separate lanes for biking and walking or running, large areas of grass for pichangas (pick-up fútbol), café literario (library café), bi-weekly government sponsored events (microempresas showcase, job fair), informal vendors (selling second-hand clothes and books, hamburguesas de soja, handmade jewelry, fanny packs, etc.), and someone may e ven drop  down from one of the trees doing an aerial silk stunt.

Img_5898

As a result of these recent thoughts I have been thinking a lot lately about the different parks I have seen in Santiago. Santiago is located in the central Chile region and experiences arid climate and highly dense urbanization thus logically it would make sense that it is a challenge to create and maintain green spaces throughout this city. Additionally Santiago is divided by comunas (districts) that that are socioeconomically polarized so one would imagine that green spaces are not equally dispersed or maintained with the same quality through out the city. In The Socioeconomics and Management of Santiago de Chile’s Public Urban Forests, Escobedo and company quantified the city’s urban forest structures by socioeconomic strata and conducted interview surveys on municipal urban forest management and expenditures. They found that “urban forests in the high socioeconomic strata had fewer public trees, greater tree cover, tree and leaf area density, and leaf area index than lower socioeconomic strata” while “the percentage of total municipal budget allocated to public urban forest management was consistent among strata, but the total public urban forest budgets were greater in the high socioeconomic strata.” Not really surprised. I guess the next question would be what are the implications of this? How do parks across the city compare in activity and safety with respect to the socioeconomic strata patterns of the Santiago?


Disneyland City

Disneyland sees about 40,000 visitors a day. The average city has a much smaller population. As I wandered through the park with my family over break, I couldn’t help but wonder how Disney handles typical municipal duties like housing, trash, and transportation.  I looked for evidence throughout the day, but as Disney intended, the duties seemed to be taken care of magically and completely behind the scenes. After a bit of research, I’ve found a few comparisons, although I’ll admit they’re a bit of a stretch. 

Underground Tunnels as Employee Housing

There is a reason you don’t see cowboys parading around in Tomorrowland and Luke Skywalker wandering in Frontierland. The cast members (ak.a. employees) have access to secret tunnels* below the park that visitors cannot access or even see, and they use these passages to navigate the park without disturbing the show. This tunnel network, called the “Utilidor” is large enough to accommodate a full size truck, and houses more than just arterial tunnels. The cast members break room, the “Mouseketeria,” a hair salon, a bank, a costume storage facility, and a bicycle rental facility are all located in the underground facility that essentially provides housing for the employees when they are off duty.

Dinsneytunnel

Source.

Truck-Free Sanitation Service

Disneyland is obviously a car-free zone, which means there cannot be any municipal cars or trucks either. What about garbage? It turns out that you never see anyone collecting the trash because it is done automatically with an automated vacuum collection system that sucks the trash from various trash receptacles in twenty-minute intervals. Eventually, it all ends up in a central sorting facility and is never seen, smelled, or felt by the visitors ever again.

Line Management as Transportation Demand Management

Everyone knows that you wait in line when you go to an amusement park. Disneyland is no exception, but how do they ensure that the lines don’t get entirely out of control?  Housed in Sleeping Beauty’s Castle is the Disney Operational Command Center, which watches as you stand in line and takes one of three actions if it feels the lines are too long. If the line is just a little too long they might radio the ride operators and deploy a few more carts or boats to speed up the loading process. If the line is a really long, they might radio Goofy and Pluto (or other characters) to go make a scene outside the specific line, distracting the waiters and maybe even enticing some diehard toon fans out of line. The third tactic is only employed for wait times that are out of control, and is called the “Move It! Shake It! Celebrate It!” This command sends a mini parade of characters and floats dancing from the congested section of the park to the least congested section, dragging ogling spectators out of the lines and along for the ride.    

*These tunnels actually only exist in Disneyworld. There is no such system in the Anaheim. 


Futures Thinking with Locals

Last Thursday evening, Taylor McAdam and I went to the Institute for the Future’s event held in conjunction with the American Planning Association. The event, An Urban Future: Futures-thinking, planning, and the future of planning cities was modeled on the workshop that I had attended a little over a month before (and posted about the evening portion here). We talked with other attendees over food before the discussion began, listened to a short presentation on the topic for discussion, and then broke out into small groups based on our interests. 

The piece of work that the evening revolved around was IFTF’s map, The Future of Cities, Information, and Inclusion, that was created with a grant from the Rockefeller Foundation. The map shows the potential results of the intersection between the two main drivers of city growth: urbanization and digitization. The map includes the key tensions and implications of smart city development at the scale of individuals, networks, and environments, incorporating trends the signals that identify them. 

The small discussion groups focused on one of the 13 intersections and analyzed the solutions and challenges they might pose for practical problems we face today. Taylor and I both chose the actionable data streams category and were grouped with two other planners who saw it have some applicability to their own work. An actionable data stream refers to usable information created from the mass amounts of information collected by environments embedded with sensors. Access to this data allows tracking of waste, circulation patterns, and environmental information, and can have wide ranging applications depending on who has access to it. 

Data

(source)

Our group’s challenges were all relatively similar: how to use this new data and technology to allow the public to see the true value of planning, whether transportation, housing, or development-related. We saw many possibilities for visualization technologies that render a realistic image for people to connect future plans to. We also saw increased potential for engaging the public, whether through online opinion forms to capture a wider audience than those who attend public meetings, or more experimental methods like creating a crowdsourcing application (we thought of a sort-of Yelp for walkability to counter the inadequacies of Walk Score). 

Overall, it was great to attend another meeting where participation is valued just as much as presentation. As students, we are so often lectured at rather than discussed with. Don’t get me wrong, it is crucial to have lectures and learn from the expertise of our professors, but this was a welcome experience where we were able to make our own connections between the material presented to us and our individual interests. 

It’s No Myth: Income Inequality in the US

There has been a lot of talk on campus lately about Stanford’s involvement with the Occupy movement. I just wanted to highlight some research done within the School of Education (by Professor Sean F. Reardon and postdoctoral fellow Kendra Bischoff) that reveals statistically why the Occupy movement is in such full force. The bottom line, as we all know, is income inequality. 

I’ll point you to the New York Times article that came out yesterday evening about their research, Middle Class Areas Shrink as Income Gap Grows. I’m excited to say I was involved in a small part of this project (with mapping their data) but as thrilled as I am to have my name in print, this isn’t a post about self-promotion. It’s a reminder that we need only look at the data to understand the social movements dominating our country’s major cities. It’s no surprise that the areas with the highest income inequality were large urban areas like Detroit, Philadelphia, and New York City, and that “90 percent of large and medium-size metropolitan areas” registered rises in inequality between 2000 and 2007. Why does this matter? The middle class is physically disappearing from our maps. Check out the article and graphs/maps and know that Stanford is involved in some great research about the persistence and worsening of inequality in the United States. 

Philadelphia_income


What’s The Score?

If you couldn’t tell, on Urbanter, we’re fans of alternative modes of transportation, whether we prefer traveling by bike (On The Road On Two Wheels), public transit (Taking Transportation), walking (Imagining a Bike-Free Stanford), or a combination of the three.  This quarter, I am taking the Urban Studies 165 course: Sustainable Urban and Regional Transportation Planning.  During a session on street redesign, we touched on the topics of pedestrian streets and “walkability,” or how conducive streets and cities are for getting around on foot.  These topics made me wonder which cities in America were considered the most pedestrian-friendly or the most “walkable.”  My curiosity led me to a list published on a smartplanet.com blog called Solving Cities.  According to the blog, out of the largest 50 cities in the United States, the 10 most walkable cities, in order are:

1.     New York City

2.     San Francisco

3.     Boston

4.     Chicago

5.     Philadelphia

6.     Seattle

7.     Washington D.C.

8.     Miami

9.     Minneapolis

10.  Oakland

Joi_ito_flickr-4096969149-medium

(photo by Joi Ito on Fotopedia)

The blog also included the 10 least walkable of the 50 largest American cities (click here for the article).  I have been to 7 of the 10 cities listed above and, while I expected some (New York City, Philadelphia), others surprised me (Miami, Boston).  I questioned the metrics used to determine these rankings and discovered that an innovative website called Walk Score was responsible for the list.

Read more of this post

Another dimension of women & work

Nanas_collage

Everyday more than 52.6 million domestic workers clean, cook, and care for children and the elderly among many other tasks to maintain private households.1 Their work relieves their employers in their countries of employment to do higher status work while their remittances to their families increase consumption and GDP in their countries of origin. Gender is also a cross-cutting dimension: Women account for 83% of all domestic workers.2 Domestic work represents the single largest category of labor migration among women.3 But despite the direct care and indirect benefits they provide society they often lack social recognition and legal protection that is guaranteed to other workers. As a result of this many women are not protected from the different forms of exploitation, trafficking, or violence that is possible due to the nature of working behind the closed doors of an employer’s home.


Since arriving Santiago I have become aware of the norm of employing a nana (domestic worker) in most middle to high-income households in this city. It has been a topic that is highly discussed in Chile in relation to national labor laws, identity studies, and even entertainment.

  • Chile is ahead of other countries in its national labor laws pertaining to domestic workers. For example minimum wage for domestic workers was established in 2009 by the Bachelet adminstration, before it was well below the minimum wage. Since then it progressively increased until March 1, 2011 when domestic workers became entitled to the national minimum wage.
  • Silke Staab and Kristen Hill Maher in their field study on domestic workers in Santiago found that in the past the domestic workers were migrants from rural southern Chile whereas today more Peruvian migrant women have taken their place. Their research explored this transition from internal to international migration exploring potential economic, structural, and historical factors such as the shaping of Chilean national identity.

(these two articles can be found in Academic Search Premier)

o   Staab, Silke, and Kristen Hill Maher. “The Dual Discourse About Peruvian Domestic Workers in Santiago De Chile: Class, Race, and a Nationalist Project.” Latin  American Politics & Society 48.1 (2006): 87-116. Print.

o   Staab, Silke, and Kristen Hill Maher. “Nanny Politics.” International Feminist  Journal of Politics 7.1 (2005): 71-89. Print.

  • The 2009 film “La Nana” also explores the experience of a Chilean maid and her struggle to make sense of her place in the family to whom she is employed. Here’s the trailer:


I met with Professor Alexander Galetovic last Friday at Universidad de Los Andes last Friday. He co-teaches “Santiago: Urban Planning, Public Policy, and the Built Environment” with Professor Ivan Poduje in the spring quarter. When I mentioned to him my interest in the presence of domestic workers in Santiago he encouraged me to also learn about how women participate in the informal economy through bilateral exchange. He described his own experience meeting women who lacked mobility to travel to city centers to work due to lack of childcare, opportunity cost of time, not being able to find jobs that matched their skill and education level, etc. and thus turn to cooking and making their own goods to sell informally on the streets or to exchange with other members of the community for goods in which they needed. Later that day I found the following article on Colorlines.com that discusses informal economy in the U.S.: http://colorlines.com/archives/2011/11/got_a_hustle_to_pay_the_rent_while_jobless_youre_part_of_a_1t_economy.html


1 Luebker, Malte, Yamila Simonovsky. Domestic Work Policy Brief 4: Global and regional estimates on domestic workers. TRAVAIL, International Labour Office. Pg. 6

2 Ibid. Pg. 8

3 Harzig, Christiane. Domestics of the World (Unite?): Labor Migration Systems and Personal Trajectories of Household Workers in Historical and Global Perspective.

Taking Transportation

Caltrain

(source)

At Stanford, in terms of getting around campus, students have it pretty easy. Many class spaces, as well as student hangout and study spaces, are a walkable or bikeable distances from dorms and houses. If you don’t have access to bikes. And for many hours of the day, students have the option of taking the Marguerite, a free shuttle service that stops at multiple points on and near campus for access to general campus destinations, medical facilities and shopping centers. And it’s free.

In San Francisco, it is another story. This summer, I lived about 45 minutes away from my internship, factoring in walking and public transportation. I am the antithesis of an early bird, so it was a daily sleepy struggle booking it to my MUNI bus stop a few blocks away from my Western Addition apartment, chasing buses, scrounging around the bottom of my bag for exact change, and assuming an upright position as a packed sardine with my fellow commuters at nine am rush hour. There were also the realities of refiguring-out routes in an unfamiliar city, due to blocked off streets due to police pursuits and broken down buses.

Transportation got trickier as I continued my internship in SF into this school year. Utilizing both Stanford and SF public transportation resources, weekly commutes would be approximately 1.5 hours each way.

My last week of my internship, I woke up at 5 am to catch the 6:24 am Caltrain (to make an 8am meeting with my boss) but had to walk to the Caltrain station since the Palm Drive Express didn’t run early enough to catch that train. Usually,there are just not enough hours in the day for classes, a part-time job, activities, assignments, and squeezing in a meal and a half… which can lead to groggily jogging to a the Marguerite bus station, having realized you missed the bus by your back-up bus by 2 minutes and now you have to take the next caltrain, meaning you’ll miss your first bus and then miss the subsequent transfer by a few minutes – so you decide to not take the SF caltrain stop and instead decide transfer to the Millbrae station and take the Bart station closest to your workplace so you don’t have to deal with the MUNI.

Hypothetically, longer transportation rides are a good time to catch up on homework. But these pre-dawn rollouts in reality result in a lack of sleep and lengthy commute during which you’re too tired to do work and too afraid to shut your eyes to catch up on your zzz’s even for a few minutes because you may miss your stop and throw your schedule off by another 30 minutes or so. To me, taking public transportation is like a sleep-deprived domino effect, if you don’t allot enough time to get from A to B.

After my summer in San Francisco and my recently finished internship, for all its faults and inefficiencies, I have a much greater appreciation for public transportation, and especially how accessible public transportation is on campus.

Due to a full fall schedule, I was unable to take URBANST 165: Sustainable Urban and Regional Transportation Planning this quarter, but my experience with train and bus travel has prompted an interest in this aspect of urban living and commuting that many people experience on a daily basis.

Change is Gonna Come…with Professor Manuel Pastor Jr.

Yesterday afternoon the Urban Studies Program had the honor of hosting University of Southern California professor, Manuel Pastor Jr. as the 2011 Urban Studies Model Scholar.  His visit marked the sixth annual Model Scholar event—a tradition in the Program that, along with an afternoon lecture, includes an opportunity for the senior Urban Studies majors (who collaboratively choose and invited the scholar during their junior year) to have lunch with the visiting scholar. If I were a senior I would give myself a pat on the back—Professor Pastor’s lecture was eye opening, inspirational, witty, and undoubtedly a display of scholarship worth emulating.

Pastor is a professor of American Studies and Ethnicity at USC, the Director of USC’s Program for Environmental and Regional Equity and the Co-Director of USC’s Center for Immigrant Integration.  The title of his lecture? “Change is Gonna Come” Why? Changing demographics.  

Inequality, shortsighted policy, and social chasms are themes with which most urban studies majors are all too familiar—they pop up in our readings, our discussions, and our exams, and they may define many of our future jobs.  Pastor used these same classic themes to describe the changing urban (and suburban) reality, and yet, the stories, facts and analyses he shared were startling and unexpected. For example, most people believe that immigration into southern California is the highest is had ever been. It turns out this is wrong; Los Angeles has not seen immigrantgrowth in the last three years. The Latino population in LA has grown by 43% since the last decade, but this is due to growth within the long-term immigrant population—the second and third generation immigrants. “LA is now a ‘home-grown’ city,” says Pastor.

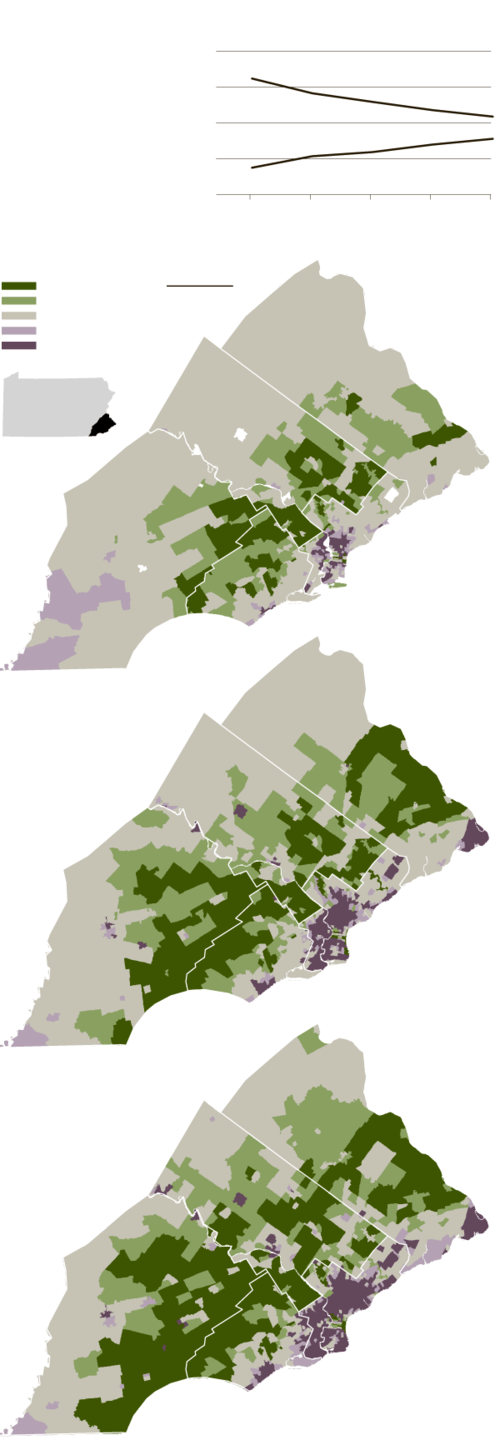
America is up in arms about the immigration problem in California when, in point of fact, we are seeing a decrease in immigration and a California that already worked through the worst of it’s immigration turmoil during the 80’s and 90’s. When Pastor says “change is gonna come” he is referring to a nation in which California is ahead of the curve.  California is already a majority minority state, and has been since 1999. The nation isn’t far behind, however, with predictions to be majority minority by 2042. What’s more, this change is not isolated to the cities as most people assume. Based on 2010 Census data, the suburbs exactly mirror American demographics.  

Screen_shot_2011-11-03_at_12

Source: Pastor’s Powerpoint

What are the impacts of these demographic shifts? For one, a demographic generation gap that is pitting the younger minority-dominated generations against an aging white population.  The median age of whites in America is 41 years, while the median age of the Latino population is only 27 years. This trend is seen across the nation (the biggest gap is in Phoenix, AZ) and the effects of this disparity are profound. Research by Pastor, as well as more typically conservative groups like IMF, have found that communities with the largest gaps have the lowest spending on education. The older generations don’t see themselves in the younger generations and as a result don’t feel the need to support the younger generations financially or otherwise. On the flipside the older generations are increasingly dependent on government-subsidized programs like Medicare, Medicaid, and Social Security, which require financial contributions from the younger generations. 

Screen_shot_2011-11-03_at_12

Source: Pastor’s Powerpoint 

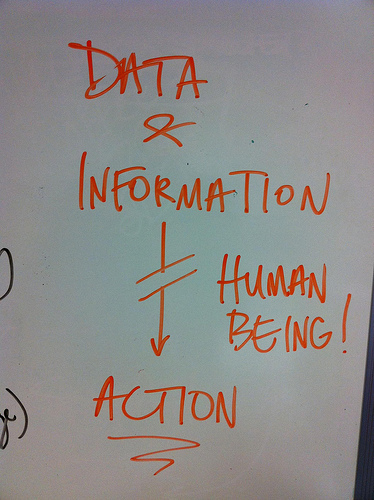
“As a whole,” said Pastor, “the American population is unequal, deregulated, and disconnected”.  In the end, these divisions are driving the lack of economic growth and spurring much of the motivation behind the Occupy Movement.  We are the “99%” is a positive message in holistically divided nation. Change is coming and the first step is to OCCUPY!    


A Look at Bombay’s Housing History

Last Friday I went to the first lecture session of City Talk: Language and the Urban Sensorium, which was a seminar on the historical formation of the South Asian city and its resulting segmented experience of urban life. Of all the regions in the world, Asia is the one I feel I have the least complete knowledgeable about; I may know less about other regions, but Asian cities seem to be overflowing with so much history, culture, and current explosive change that I feel that I’ve hardly scratched the surface.  The lecture that spoke to me the most was Nikhil Rao’s discussion of Community and Urban Citizenship in Bombay.

I won’t pretend to understand the historical, philosophical, and anthropological models that provided a theoretical basis for his lecture, but I will talk about some of the things that struck me as most interesting about housing in Bombay. The housing structure in the state of Maharashtra (previously the state of Bombay) was revolutionized in 1913 when the Bombay Co-Operative Housing Association was established to aid rural farmers and increase access to credit. Co-ownership of apartments had the double benefit of being cheaper while also making the lower classes stakeholders in society.

Slum

Dharavi, extending into Mumbai, is one of the world’s largest slums. In the 1960s Dharavi’s Cooperative Housing Society was established to alleviate the conditions of the poor. (Source).

Another important shift came in the 1950s and onward, when the ownership flat came to be prevalent. After Indian independence in 1947, the lower and middle classes began purchasing apartments instead of renting space in tenements. Still part of the Cooperative Housing Society (CHS) system, the ownership flat allowed individuals to own houses or apartments while the land under them belonged to society.  The CHS became the legal mechanism to assert housing rights, and were encouraged to organize on the basis of community. Interestingly, it was customary to let renters and owners live in their homes as long as they wanted, even though it was technically a tenancy at will. More common than house ownership given the city’s density, of course, was apartment ownership. Read more of this post